KPI Dashboard

Get KPI Dashboard to Tracking Your Performance Easier

The KPI dashboard unifies data sources and displays them in graphs or charts, illustrating your business performance achievements.

  • Track KPIs and other business metrics in real time.
  • A unified data view that enhances business visibility.
  • Customizable data visualization with KPI.
  • Saving your valuable time and effort.

CRM Salesman tingkatkan produktivitas dan penjualan

More than 3,500+ businesses in Indonesia uses Mekari Qontak KPI Dashboard

Advantages of using KPI Dashboard

icon

Flexible

The KPI dashboard is very easy to adapt to business needs.

icon

Affordability

The KPI dashboard has powerful features that can cover all business needs.

icon

Accurate

An automated KPI dashboard displays all the data a business needs without errors.

icon

Actionable

The data displayed on the KPI Dashboard is easy to understand, so you can follow up on it.

Build your meaningful and streamlined dashboard.

Custom your KPI dashboard according to a measured metrics with a simple view, so it is easy for your team to understand.

Make your dashboard simple

Make your dashboard simple

  • Get complete insights about customers displayed in one dashboard.
  • Kanban visualization with easy drag & drop to track customer tickets and orders.
  • One dashboard with many pipelines that makes it easy to monitor business performance.
Complex data visualization

Complex data visualization

  • Access to customer data is very limited.
  • Difficulty in monitoring orders and tickets because it is not centralized.
  • Dashboard that cannot be customized according to business needs.

Start tracking your metrics now!

Track business performance in real time

Mekari Qontak provides features to help you track all business performance more efficiently.
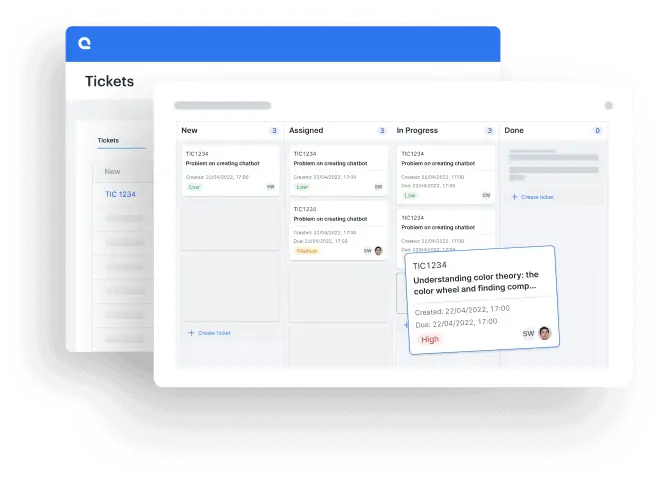
Get comprehensive report

  • Monitor all activities in one dasbord with more than 40 Sales and Customer Service report templates.
  • Review employee performance and tasks in real time to ensure smooth running of operations.
  • Customize comprehensive reports for better business decision-making in the future.
Get comprehensive report

Difficulty in ensuring smooth operations

  • Hassle in switching applications while monitor sales channels to ensure business runs smoothly.
  • Inconvenience in reviewing employee performance over many communication channels.
  • Manual report generation increases risk of human error while recapping data from each channel.
Difficulty in ensuring smooth operations

Monitor your business efficiently

Make better business decisions

Use insights from the KPI Dashboard to make effective business decisions to improve sales and service.

Get more value from your data

Get more value from your data

  • Understand of your customers from their interaction history displayed on the dashboard.
  • Learn sales and service trend lines against KPI to make better business decisions.
  • Analyze and evaluate your business performance, then make improvements.
Difficult to make effective decision

Difficult to make effective decision

  • Customer data is not centralized, that it is difficult to understand them.
  • It is difficult to know the sales and service trends of the company.
  • Report is very limited to be analyzed because it is not update.

Grow your business efficiently!

Whats is KPI Dashboard?

The KPI Dashboard (Key Performance Indicator Dashboard) is a tool that provides an instant overview of the company’s performance through a dashboard. It also helps the management team identify where problems are developing in real time. So, they can immediately solve the problem.

KPI software is also useful for measuring whether business operations are on the right track. The KPI dashboard brings together all the key performance indicators in one CRM tool for easy analysis.

What are the Benefits of a KPI Dashboard?

The benefits of the KPI dashboard are:

  • Track the performance of team members and all the activities they perform
  • Increase efficiency, because all data can be quickly accessed and used
  • Facilitate better decision-making
  • Improve the company’s focus on the most important indicators
  • Flexible towards business growth
  • Track sales attendance or location with live GPS tracking
  • Monitor KPIs anytime and anywhere via smartphone

Steps to create a KPI dashboard are:

  • Set targets to be measured
  • Choose KPI metrics carefully
  • Create interactive KPI dashboard template designs
  • Build your KPI dashboard with meaningful charts.
  • Share dashboard.
WhatsApp Whatsapp sales